A PageSpeed score is not a performance strategy. A useful Core Web Vitals audit identifies which real customers are having a slow experience, which page template and interaction creates it, what change is likely to help, and how the team will prove the fix without breaking revenue-critical behaviour.
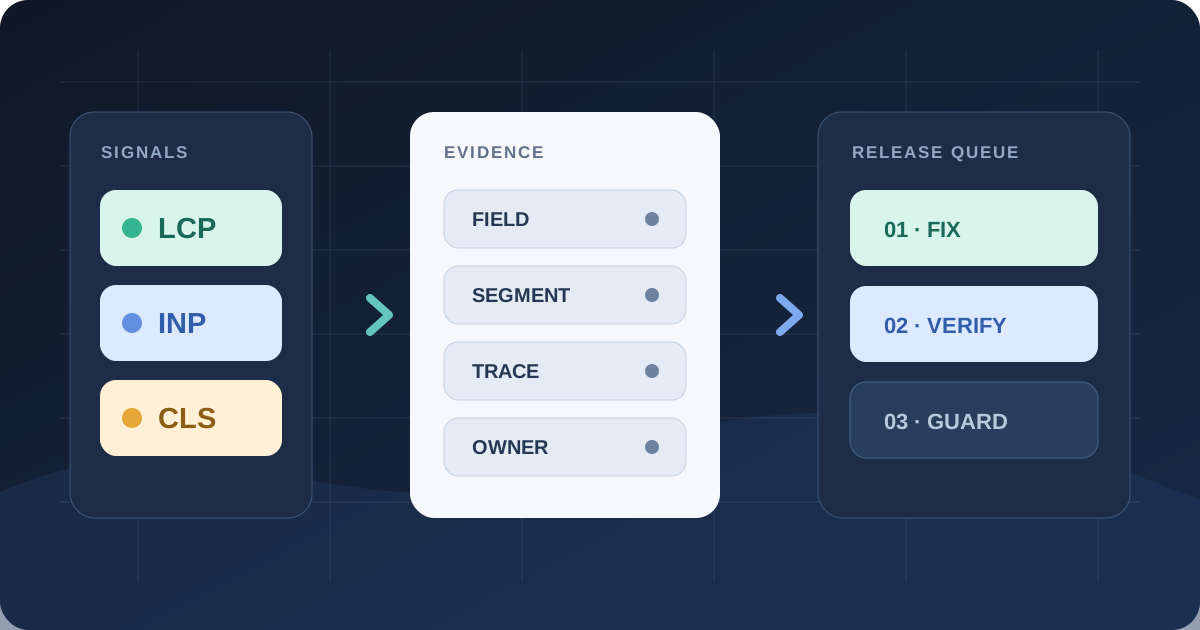
Start with real-user data, group pages by business journey and template, reproduce one failure in the lab, and fix the bottleneck shown by the trace—not the longest list of generic recommendations. Then protect the gain with a small performance budget and product monitoring.
Core Web Vitals are thresholds, not the customer journey
Google’s current Core Web Vitals are Largest Contentful Paint (LCP), Interaction to Next Paint (INP), and Cumulative Layout Shift (CLS). A good result is LCP at or below 2.5 seconds, INP at or below 200 milliseconds, and CLS at or below 0.1, evaluated at the 75th percentile. In plain language: the main content appears promptly, interactions respond promptly, and the layout does not move unexpectedly.
These numbers are useful common constraints. They do not explain whether the slow visit was a first-time mobile shopper opening a category page, a returning customer changing a cart quantity, or a sales prospect submitting a form. They also do not promise rankings or revenue. Google says good Core Web Vitals are recommended for Search and user experience, but page experience is only part of its ranking systems.
Define business-sensitive journeys before opening PageSpeed Insights: product discovery to cart, cart to payment, campaign landing page to lead, sign-in to account action, or article to enquiry. Record the key action and the templates that support it. This prevents the team from optimizing a visually impressive homepage while the product list, checkout, or form remains slow.
Use an evidence ladder: field, segment, lab, trace
Field data and lab data answer different questions. Chrome UX Report (CrUX) data in PageSpeed Insights describes eligible real Chrome visits over a rolling 28-day window. Search Console groups similar URLs and separates mobile from desktop. Lighthouse runs a controlled synthetic visit and offers diagnostics. A green lab run cannot erase a poor field distribution, and a red lab run does not prove every customer has the same problem.
| Layer | Question | Useful output |
|---|---|---|
| Search Console / CrUX | Is there a real-user problem at page or origin level? | Metric, device, URL group, 75th percentile, trend |
| First-party RUM | Which template, market, device, journey, or release is affected? | Attributed samples without personal data |
| Repeatable lab test | Can the team reproduce a representative slow case? | Median runs under recorded conditions |
| Browser trace | Where is time actually spent? | Network, main-thread, rendering, and element evidence |
| Business telemetry | Does the problem intersect with an important action? | Completion and error rates by the same cohort |
If a URL lacks enough CrUX traffic, do not substitute the origin result as if it were page-specific. Label it honestly, use representative templates and first-party real-user monitoring, and wait for sufficient evidence. Collect metric attribution such as the LCP element or slow interaction target, but avoid form values, personal identifiers, full URLs with sensitive query parameters, or session replay by default.
Expect lag after a release: the public field result blends visits from the previous 28 days. Use lab tests and your own release-tagged telemetry for early confirmation, then watch the field distribution mature. Do not keep deploying random changes while waiting; that destroys attribution.
Audit a representative matrix, not every URL
Group pages by shared template and behavior: homepage, category, search, product, cart, checkout, article, service page, form, and authenticated application. Add variants that change execution: mobile and desktop, logged in and logged out, consent accepted and declined, empty and populated cart, cached and uncached response, major locale, and slow but commercially important market.
Choose one to three representative URLs per group, plus known outliers. Record traffic, conversions or lead value, current field status, lab baseline, responsible team, and recent releases. Search Console’s examples represent groups of similar URLs, not a complete list of every failing page; confirm the shared template before applying one fix everywhere.
Test important interactions, not only initial load. Open navigation, search and filters; choose a variant; add, remove, and change quantity; reveal delivery options; validate and submit a form. INP is measured across the page lifecycle. A page can load quickly and still freeze when a filter renders 500 items or a consent, chat, analytics, or recommendation script occupies the main thread.
Turn each metric into a specific hypothesis
LCP: find which of four parts is slow
Google breaks LCP into time to first byte, resource load delay, resource load duration, and element render delay. That decomposition prevents ritual fixes. If the server is slow, compressing the hero image will not repair the initial response. If the browser discovers the image late because JavaScript inserts it, a smaller file may finish sooner but still render at the same time. If CSS or hydration hides a loaded element, the network is not the last bottleneck.
Check the actual LCP element by template and viewport. Then inspect server timing, redirects and cache behavior; whether the resource is present in initial HTML; preload and fetch priority; responsive dimensions and format; blocking styles and fonts; and client rendering. Preserve image quality appropriate to the product. “Make every asset tiny” is not a business requirement.
INP: name the interaction and the delayed phase
INP consists of input delay, event-handler processing, and presentation delay. Record the interaction target and action. Long startup tasks can delay a tap before its handler begins; expensive filter logic can dominate processing; a large DOM and repeated layout work can delay the next frame. The remedies differ.
Reduce unnecessary JavaScript, split long work, yield after the essential interface update, render less DOM, and avoid synchronous layout loops. Load optional tools deliberately. A chat widget or tag may be valuable, but its value does not justify running every task before the customer can interact. Use the existing third-party script audit when external code is a material part of the trace.
CLS: preserve space and investigate late changes
Look for images or embeds without dimensions, banners injected above existing content, swapped fonts, recommendations or reviews arriving without reserved space, and transitions that trigger layout. Test after load as well as during it: cookie choices, validation errors, expanding accordions, cart updates, and back/forward navigation can expose shifts a simple load test misses.
Reserve realistic space, keep messages near the action that caused them, use transform-based motion where suitable, and avoid hiding essential content just to lower a metric. A fixed empty box larger than the eventual content may improve CLS while degrading the interface. Review the actual journey.
Prioritize expected customer impact, not easy points
Score each opportunity on four dimensions: affected real visits, importance of the journey, confidence in the diagnosis, and implementation risk. A product-template LCP problem affecting most mobile discovery traffic can outrank a severe issue on a rarely used campaign page. A checkout INP issue affecting fewer visits may still be first because it blocks payment.
Write backlog items as testable changes: cohort and template, observed symptom, attributed bottleneck, proposed change, owner, acceptance check, rollback condition, and earliest trustworthy field review date. “Improve PageSpeed to 90” is not an engineering ticket. “Make the product hero discoverable in initial HTML and verify lower resource-load delay on five mobile product templates” is.
Protect functional constraints. Analytics, fraud controls, accessibility, consent, product imagery, and payment behavior must still work. Compare conversion and error telemetry with performance changes; do not claim causation from a before-and-after chart that also spans a campaign, pricing change, or seasonality.
Ship narrow changes and prevent regression
Capture a stable baseline and run lab tests multiple times under the same configuration. Lighthouse itself documents natural variability and recommends repeated runs; use a representative median rather than celebrating the best result. Verify the relevant trace and user journey, then release progressively where possible.
Add a small budget tied to the diagnosed risk: maximum critical JavaScript on product pages, maximum hero bytes, no new render-blocking third-party origin, or a template-specific lab metric guard. Lighthouse CI can run repeated tests and assert budgets, but synthetic metrics are regression alarms—not a replacement for real users.
After release, check errors, transactions, and first-party RUM immediately; compare a tagged rollout cohort over the next few days; then review CrUX and Search Console after the rolling window has enough post-release traffic. Keep the change only if the relevant distribution improves without unacceptable product regression.
A focused 14-day website speed audit
The deliverable is not a PDF full of screenshots. It is a template inventory, evidence table, prioritized backlog, trace for each top issue, implemented quick win, performance guard, owners, and dates for field verification. If the diagnosis is uncertain, say what data is missing and instrument it before prescribing a rewrite.
Frequently asked questions
Do I need a PageSpeed score of 100?
No. The score is a lab summary and can vary. Focus on real-user Core Web Vitals, important journeys, diagnosed bottlenecks, and regressions you can prevent.
Why are PageSpeed field and lab results different?
Field data aggregates eligible real Chrome visits over 28 days; Lighthouse runs one controlled synthetic scenario. Devices, networks, cache state, geography, consent, content, and interactions differ. Use field data to locate the problem and lab traces to diagnose it.
How quickly will Core Web Vitals improve after a fix?
Your own telemetry can show an effect soon after release. Public CrUX and Search Console results use a rolling 28-day window, so visible status changes take time and sufficient traffic.
Which metric should an online store fix first?
Fix the issue with the greatest expected customer impact. Often that is a widely affected product-template LCP issue or an interaction delay in cart or checkout, not automatically the lowest metric on the homepage.
Do good Core Web Vitals guarantee higher rankings?
No. Google recommends them for search success and user experience, but page experience is one part of broader ranking systems. Useful content and other signals still matter.
Sources and verification date
Verified 10 September 2026 against Google Search Central’s Core Web Vitals guidance and Search Console report documentation, Chrome’s CrUX tools methodology, and web.dev guidance on field versus lab data, LCP diagnosis, and INP diagnosis. Regression guidance also reflects the official Lighthouse CI project. Thresholds and tool behavior can change; recheck before setting contractual targets.
Rendframe can map the journeys, add privacy-conscious real-user measurement, trace the bottlenecks, implement the highest-value fixes, and add regression checks. Explore product engineering, compare performance with the checkout-friction audit, or send one slow URL and its most important customer action.